

Last Updated on February 6, 2025
One of the most common questions I receive is, “How much should I be giving?”
As with most questions, the answer is “it depends”, but something I’ve found helpful over the years is to be able to point to charitable giving statistics to help with the decision.
People like points of comparison. Let’s dive into different charitable giving statistics, charitable giving by countries, age, religion, and other demographics.
Charitable Giving Statistics in 2025
Below are a few statistics that stand out.
- There was a 2.1% decline in giving in 2023.
- The average donor age in the US is age 64. This has increased since 2016 when it was age 62.
- The average donation amount was $813.
- The median donation amount for gifts below $1,000 was $20.
- The median donation amount for gifts above $1,000 was $2,500.
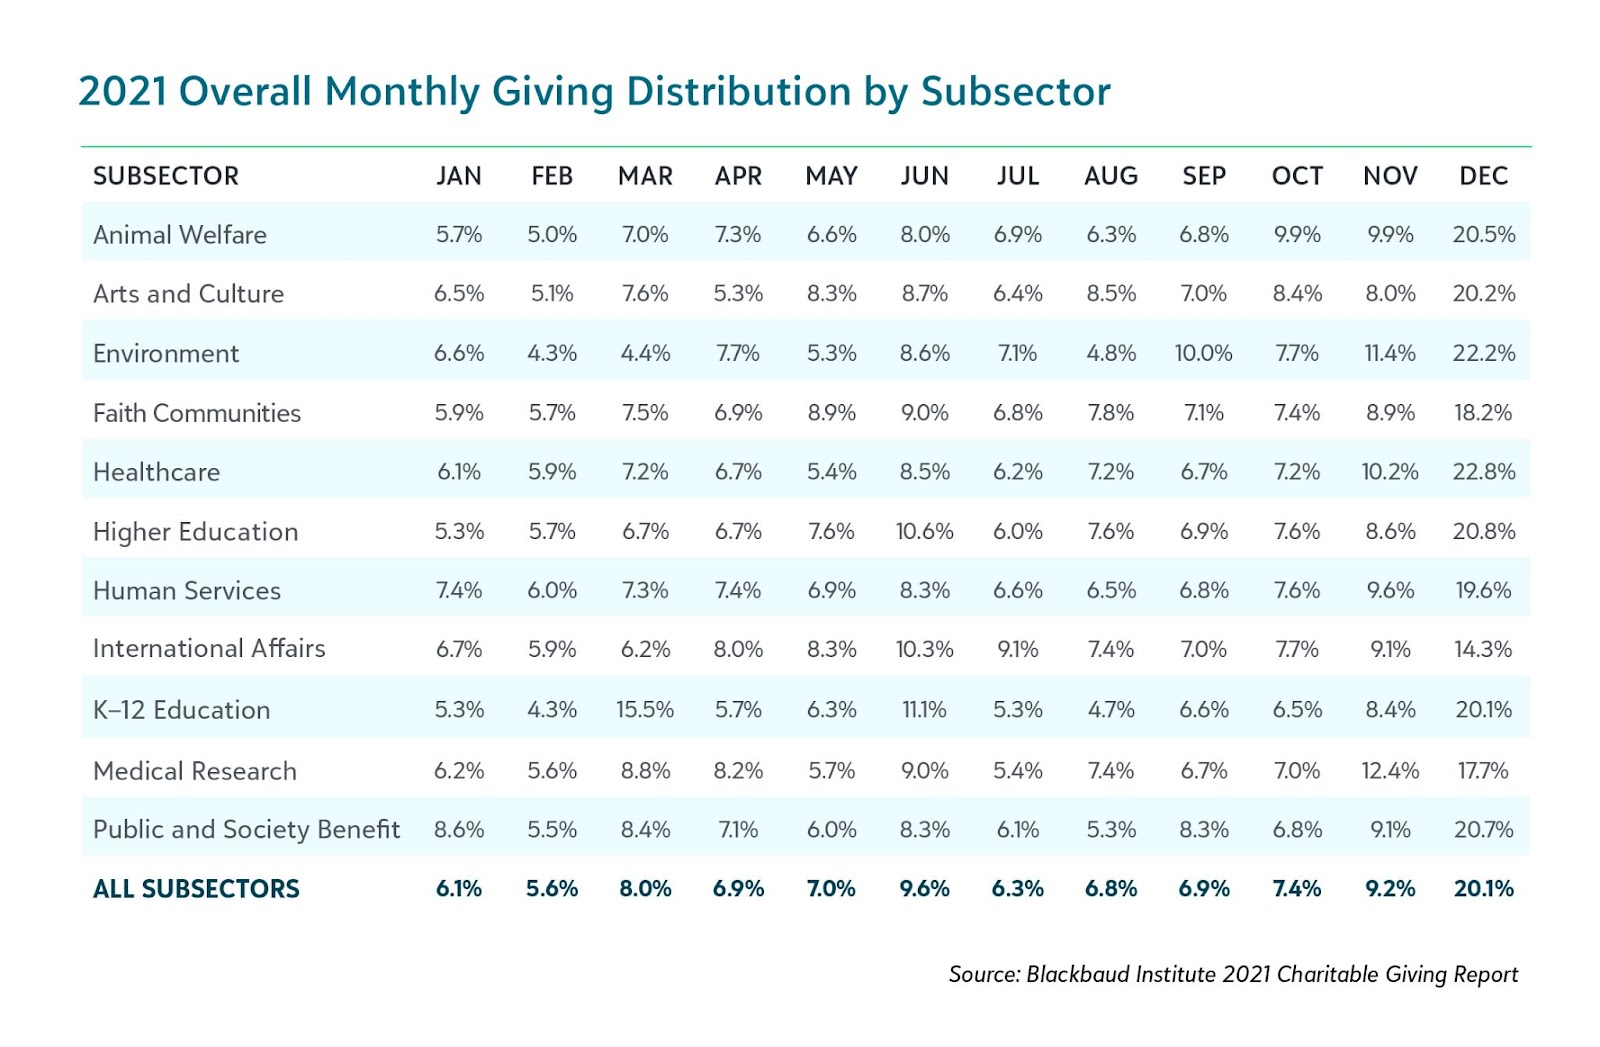
- People gave the most to charity in December. It’s over double any other month. In 2021, it was around one fifth of all giving.
- In 2023, about $577 billion was given to charity.
- Individuals accounted for about 67%, or $374 billion, in charitable contributions in 2023. Corporations accounted for about 5%.
- The assets in donor-advised funds grew from $31.1 billion in 2006 to $250 billion in 2022.
- It’s estimated that 25% of all adults volunteer. The average time given is 139 hours per year.
- About ⅓ of US households don’t give. Of the ⅔ that do give, they donated an average of 4% of their income.
- Only about 1 in 10 people making above $125,000 do not give.
- About 37% of people who make under $25,000 give to charity, but those that do, give about 12% of their income.
- The top five states where people reside who give most (as a percentage of adjusted gross income) are Utah, Mississippi, Alabama, Tennessee, and Georgia, as of 2012.
- The top five cities where people reside who give most (as a percentage of adjusted gross income) are Salt Lake City, Memphis, Birmingham (AL), Atlanta, and Nashville, as of 2012.
Which Countries Give the Most to Charity?
The US gives more than any other country. It’s estimated that the annual private philanthropy as a percentage of GDP is about 1.44%.
It’s nearly double what Canada gives at 0.77% and about triple what the UK gives at 0.54%.
Other developed countries lag even further. Below are a few other countries with their annual private philanthropy as a percentage of GDP.
- China: 0.03%
- France: 0.11%
- Japan: 0.12%
- Sweden: 0.16%
- Germany: 0.17%
Charitable Giving Statistics – Demographics
Who is the typical donor in the United States? Let’s look at the charitable giving demographics.
What is the Average Age of a Donor?
The average donor age in the US is age 64, making the average donor a Baby Boomer.
How Much Do People Give on Average?
It’s difficult to find exactly how much people give to charity on average, but there are a few different statistics.
The average amount donated to charity is about 2-5% of income.
The average charitable deduction for those claiming a deduction was $16,197 for tax year 2020. It’s important to note this only includes people who itemize deductions.
Below is a chart for the average charitable contribution deduction in 2020 by adjusted gross income. Please note that this won’t include people who don’t itemize their deductions.

Where Do People Live Who Give the Most to Charity?
According to WalletHub, which measures the most charitable states differently than other reports, the top five most charitable states are:
- Utah
- Wyoming
- Minnesota
- Maryland
- Maine
Their study looked at charitable giving and volunteering to give states a combined score.
If you look solely at charitable giving and not volunteering, the top five states are:
- Virginia
- Maryland
- New York
- Georgia
- Utah
If you look solely at volunteering and not charitable giving, the top five states are:
- Wyoming
- Maine
- Minnesota
- Utah
- Oregon
Looking at giving as a percentage of adjusted gross income in 2012, the top five states that gave the most to charity are:
- Utah: 6.6%
- Mississippi: 5.0%
- Alabama: 4.9%
- Tennessee: 4.5%
- Georgia: 4.2%
As you can see, it’s tough to say which states are the most generous in giving their money and time. It largely depends on how you measure giving – whether that is total dollars given or giving as a percentage of income.
It is clear that Utah is a very charitable state. Most experts agree it has to do with the large population of Mormons and how much they give to charity.
Looking at giving as a percentage of adjusted gross income in 2012, the bottom five states that gave the least to charity are:
- New Hampshire: 1.7%
- Maine: 2.0%
- Vermont: 2.0%
- New Jersey: 2.0%
- Rhode Island: 2.1%
What Do People Give Besides Cash?
Besides cash, people can give real estate, stock, art and collectibles, clothing, cars, planes, airline tickets, and easements. Below is a graph of noncash charitable contributions in 2018.

As you can see, easements are the largest noncash charitable contributions. Easements are where a property owner gives up certain rights of ownership to preserve their land or buildings.
Easements have a high potential for abuse, and the IRS regularly scrutinizes these deductions.
Charitable Giving by Age
Charitable giving varies by age and generation. Let’s look at how each generation gives and other notable statistics.
Millennials
About 60% of Millennials give to charity. The average annual charitable contribution is $481 across 3.3 charities.
It’s reported that Millennials tend to support the following charities:
- Their place of worship
- Health charities
- Children’s charities
- Human rights and international development
Gen X
About 59% of Gen Xers give to charity. The average annual charitable contribution of a Gen Xer is $732 across 3.9 charities.
It’s reported that Gen Xers tend to support the following charities:
- Their place of worship
- Animal rescues
- Children’s charities
- Local social services
Baby Boomers
About 72% of Baby Boomers give to charity. The average annual charitable contribution is $1,212 across 4.5 charities.
Baby Boomers account for about 43% of all charitable donations.
It’s reported that Baby Boomers tend to support the following charities:
- Their place of worship
- Animal Rescues
- Children’s charities
- Local social services
Silent Generation
About 88% of the Silent Generation give to charity. The average annual contribution of the Silent Generation is $1,367 across 6.2 charities.
It’s reported that the Silent Generation tend to support the following charities:
- Their place of worship
- Troops and veterans
- Emergency relief efforts
- Local social services
Religion and Charitable Giving Statistics
A 2013 report estimated that about 73% of American charitable giving goes to religious charities. An estimated 41% goes to congregations directly and 32% goes to religious charities.
That means only about a quarter of all charitable giving goes to groups with no religious tie.
Depending on what reports you look at, people with any religious affiliation give more than people with no religious affiliation. Depending on the report, it can be 2 to 3 times more.
Corporate Charitable Giving Statistics
Although corporate giving might seem like a big portion of the charitable giving pie, it’s actually not.
Corporate giving totaled about $36.55 billion in 2023, which is about 7% of all giving.
Some companies give to charity directly while others provide generous matches. For example, companies like ExxonMobil, Johnson and Johnson, Microsoft, Google, Apple, and a few others all offer corporate matching programs of $10,000 or more.
Other companies build it into their identity. Ben and Jerry’s commits 7.5% of the company’s annual pretax profits to philanthropy.
Volunteering as Charitable Giving
Volunteering is a form of charitable giving, but much harder to capture in reports because volunteering is usually not tax-deductible.
Americorp estimates that 30% of the United States, or about 77.9 million people volunteered in 2019.
It’s estimated that volunteers gave about 4.1 billion hours to charity, which translates to an economic value of $122.9 billion.
GivingTuesday
GivingTuesday is a “global generosity movement unleashing the power of radical generosity.”
What is GivingTuesday?
GivingTuesday is one day where hundreds of millions of people come together to give. In the United States, $3.6 billion was raised on GivingTuesday in 2024.
It was created in 2012.
Many nonprofits participate in GivingTuesday by emailing and creating campaigns to encourage giving. Many corporations and nonprofits offer matching grants on GivingTuesday, which encourages even more giving.
When is GivingTuesday?
GivingTuesday is on Tuesday, December 2, 2024. In 2025, Giving Tuesday will be on Tuesday, December 1.
It falls on the Tuesday after Thanksgiving in the United States.
Why Should I Give on GivingTuesday?
GivingTuesday can be a great day to give because nonprofits often secure matching grants. For example, some benefactors may offer a $50,000 matching grant if a local nonprofit can raise $50,000 themselves. Your employer may also offer matching grants up to a certain amount.
It’s rare for nonprofits to see matching grants that can double the amount given, so it’s an effective time to give to help them unlock those matching grants.
When Should You Give?
Ideally, you should spread your giving over the course of a year. Most charitable organizations receive the majority of their donations in December, making it an extremely busy time.
Below is a chart showing overall giving by subsector. As you can see, about 20% of giving occurs in December. I would guess that of the 20%, the majority of that happens in the last two weeks.
Since charities have payroll, programs, and other expenses they need to fund, it’s better for them if they receive donations at other times of the year to budget. Many nonprofits I’ve talked with tell me they prefer regular, ongoing donations rather than lump sum donations.
You can imagine if you rely on lump sum donations once a year, it’s much harder to plan your budget and how much money you have to support your programs. Imagine if your company relied on donations once a year, but had to make payroll every month. They would have a very hard time trying to decide how many people to hire and at what salary because they have no idea if they can count on the lump sum donations they received last year.
If you feel more comfortable with lump sum donations instead of a recurring commitment, consider giving during other times of the year, such as the spring and summer.
Not only is this beneficial to the charity, but it’s beneficial for you. If you are giving stock, I’ve seen custodians struggle completing requests before the end of the year. Plus, you get more time to spend with friends and family during the holidays without needing to worry about where you will give.
Personally, I see summer as a great time to give as people often have more time while on vacations to think about their giving. The other added benefit is that if you want to include other family members in your giving, summer vacations often are a perfect time to discuss charitable giving as a family. You may have a long flight or car ride to discuss what sort of organizations you want to support, how much you want to give, and more.
Lastly, consider giving unrestricted donations to charity. Many people like to direct their charitable giving to particular programs, but the charity, who is doing the work everyday, is going to have a better sense for where funds need to be directed. Plus, the charity needs donations to support staff, office expenses, and other expenses to make the charity run. Without them, programs don’t get implemented.
How to Evaluate a Charity
If you are trying to decide where to give, consider researching charities on websites like GiveWell or Charity Navigator.
GiveWell has top charities they recommend. They look at how much good a program can accomplish, such as lives improved, per dollar spent. They rate less charities, but they do more in-depth analysis.
Charity Navigator has a star rating system and a score out of 100. They analyze financial performance metrics, transparency metrics, expenses, leadership, connection to community, constituent feedback, and more.
I know many donors tend to focus their giving on charities with low administrative costs and although it’s an important data point, it’s important to remember that to hire competent, knowledgeable, and experienced people, it costs money. If administrative costs are always kept as low as possible, it may mean they are not paying staff enough, leading to turnover, and less effective implementation of programs.
I mention this because many people look at administrative items as a line item of money not going directly to the people the charity serves, but that line item is someone’s livelihood, ability to fundraise for the organization, and implement good work in the communities they serve.
Final Thoughts – My Question for You
Despite the last few years of the pandemic and higher inflation, charitable giving remains important to certain parts of the population.
While older generations are giving more, younger generations are still giving. While most charitable contributions are given to religious organizations, there are still plenty of charitable organizations that are not affiliated with any religion.
As you decide when to give and how to evaluate charities, consider giving outside of December and focusing on more metrics than purely administrative expenses.
I’ll leave you with one question to act on.
When will you make your charitable donations this year?

