
A Guide About Historical Tax Changes, How Taxation Changes Behavior, US Debt Concerns, and Tax Planning Ideas
With tax rates near historical lows, federal debt rising, and interest rates still fairly low compared to historical averages, should you be afraid of tax rates rising?
As a financial planner, tax planning is important. It would be helpful if I had a crystal ball that told me exactly how and when taxes will change in the future. For many clients, I can forecast how I think their income will change with Required Minimum Distributions, Social Security, pensions, inheritances, and other income sources, and that can give me a rough idea of what tax bracket they may be in later.
Unfortunately, I don’t have the crystal ball that tells me what tax rates will look like in the future, which means it’s worth examining how taxes have changed over time. While knowing what has happened historically won’t tell me how tax rates will change in the future, it can allow me to speculate and discuss the pros and cons of tax planning decisions today.
With the passage of the One Big Beautiful Bill Act, the tax rates from the Tax Cuts and Jobs Act are “permanent.” I use quotes because they are permanent until new tax legislation is passed.
I don’t know when new tax legislation will pass, but let’s look at the history of income taxes in the United States to make a more informed decision around tax planning decisions today.
To be perfectly clear, this is a thought exercise with my own speculations throughout. They are likely to be wrong. Do not make financial planning or tax planning decisions based on this educational information.
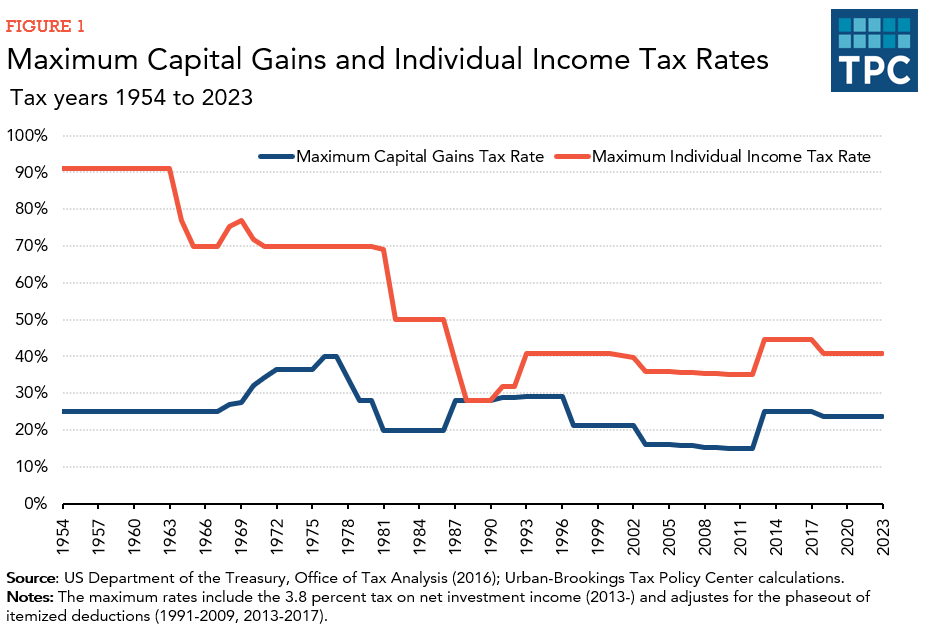
Historical Top Marginal Income Tax Rate
It’s easy to look at historical top marginal tax rates and say we are near lows. If you look at the blue line in the graph below, it shows the highest income tax rate by year.
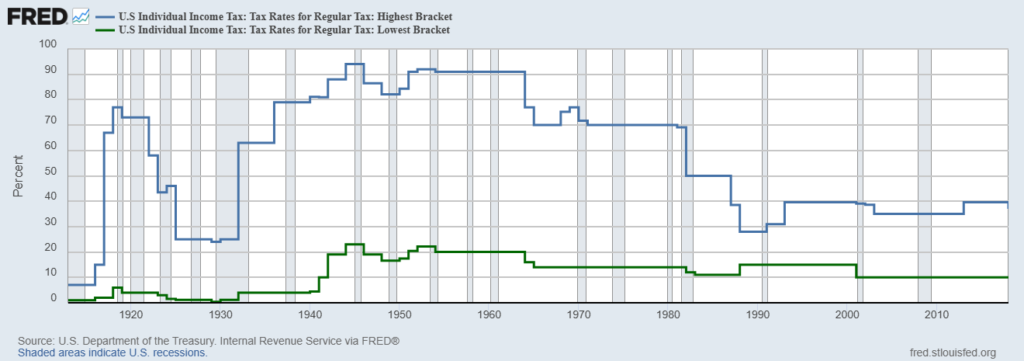
Source: https://fred.stlouisfed.org/graph/?g=jm6o#
People like to fear monger and point to the 1950s and early 1960s and say people were paying a tax rate of 91% on their income. In other words, they only got to keep 9 cents for every $1 they made.
The problem with this is that it’s estimated that the top 1 percent of taxpayers in the 1950s only paid about 42% of their income in taxes.
To put it in perspective, in 2014, it was estimated that the top 1 percent of taxpayers paid an average tax rate of 36.4%.
In other words, taxes were higher in the 1950s, but not to the extent people often make it seem.
The top 91% rate applied to income above $200,000, which is about $2.7 million in today’s dollars. Fewer than 10,000 households out of the 45.6 million tax filers would have had that level of income.
But, what happens when tax rates are high?
Tax avoidance goes up!
You can spend a lot more money coming up with creative tax schemes, or downright fraud, if it means avoiding a 91% tax rate. For example, if $1 million of income is going to be subject to a 91% tax rate, that’s $910,000 in taxes for the government and $90,000 to the individual. In that scenario, it’s easy to justify paying tens of thousands or even hundreds of thousands to accountants and lawyers to come up with a creative tax scheme to avoid paying that much.
There were many loopholes the wealthy could take advantage of. They could accelerate depreciation from rental real estate, structure income generated in one year into multiple years, take an oil depletion allowance, and use a collapsible corporation.
Again, it pays to get creative and risk more in tax shelters if you are only receiving $9 for every $100 you earn above a certain rate. How much would you spend to keep more of your money?
How much you might spend looks different at a 50/50 split or 30/70 split.
Not everybody pays the top tax rates, so you may be wondering, “What about me? What about the middle tax brackets? How have those changed over time?”
To answer that question, let’s look at the history of tax brackets in the United States, why tax legislation has been passed, and how things have changed over the decades.
History of Tax Brackets
I’d encourage you to download the US tax brackets going back to 1862 here: https://taxfoundation.org/data/all/federal/historical-income-tax-rates-brackets/. You can see for yourself how tax rates have changed and in what ways our tax code has changed.
My summary about how tax brackets have changed is below.
1862 and 1863
Prior to 1862, income taxes didn’t exist in the U.S. Colonists paid property taxes, excise taxes, and tariffs. Even back then, the North and South fought over tariff policy until the Civil War. It was the primary source of government revenue.
While income taxes didn’t exist until 1862, it’s interesting to note that the earliest example of an income tax is from 9 BCE in China, which had a 10% tax on net agricultural income and other forms of trading.
I mention this because there are many different types of taxes, and while income taxes may rise in the future, new taxes or changes to other types of taxes may be passed instead of major changes to income taxes.
The first income tax was created through The Civil War Revenue Act of 1862 and was specifically passed to raise money for the Union cause. It helped raise $55 million.
It was a simple tax structure. People paid a tax of 3% on income above $600 and below $10,000. For amounts above $10,000, they paid 5%.
1864 – 1872
The tax brackets more or less look like how it was originally passed, but with a few changes. They increased the tax rates a little and then lowered them. From 1867 to 1869, it was a flat 5% on income above $1,000 and then from 1870 to 1872, it was a flat 2.5% on income above $2,000.
To put it in perspective, the average manufacturing workday was 10.8 hours and the average annual earnings was $384 in 1870.
The income tax wasn’t a big revenue producer. 90% of all revenue came from taxes on liquor, beer, wine, and tobacco from 1868 until 1913.
You can read interesting facts and stories about income tax records from the Civil War years.
Congress gradually reduced the income tax once the Civil War ended in 1865. They knew that since the income tax had been introduced to fund the war, citizens would call for it to be reduced.
Then, in 1872, the income tax was repealed.
1873 – 1893
From 1873 to 1893, there was no income tax.
1894
The Wilson-Gorman Tariff Act brought back income taxes while lowering tariff rates.
The income tax was 2% on amounts above $4,000 and fewer than 1% of households paid taxes. As a comparison, about 60% of households in 2025 pay federal income taxes.
1895 – 1912
The Supreme Court ruled the income tax unconstitutional because it was a direct tax and not apportioned among the states on the basis of population.
There was no income tax through 1912.
1913 – 1915
You can thank the 16th amendment for modern-day federal income taxes. Unfortunately, filing isn’t as simple as it was back then when Form 1040 was only four pages!
The Revenue Act of 1913 was passed after the 16th Amendment was ratified by the states. The goal was to push the tax burden onto the wealthy as tariff revenue was declining and industrialization took place.
Below were the brackets. The $500,000 figure is about $16.5 million in today’s dollars.
1.0% > $0.00
2.0% > $20,000.00
3.0% > $50,000.00
4.0% > $75,000.00
5.0% > $100,000.00
6.0% > $250,000.00
7.0% > $500,000.00
1916
In 1916, tax rates were raised to help finance World War I. It was also the year the estate tax was introduced.
1917 – 1921
The top tax rate jumped from 15% to 77% during these years due to the War Revenue Act of 1917. As you can see below for 1917, there are many tax brackets during this time. Again, you had to be an extremely high earner to pay that top tax rate.
Below are how tax rates looked in 1917.
2.0% > $0.00
4.0% > $2,000.00
5.0% > $5,000.00
6.0% > $7,500.00
7.0% > $10,000.00
8.0% > $12,500.00
9.0% > $15,000.00
12.0% > $20,000.00
16.0% > $40,000.00
21.0% > $60,000.00
26.0% > $80,000.00
31.0% > $100,000.00
35.0% > $150,000.00
41.0% > $200,000.00
46.0% > $250,000.00
50.0% > $300,000.00
54.0% > $500,000.00
59.0% > $750,000.00
65.0% > $1,000,000.00
66.0% > $1,500,000.00
67.0% > $2,000,000.00
The increase in tax rates increased federal receipts. They went from under $75 million in 1914 to almost $4 billion in 1918.
Not surprisingly, the government received 3,473 tax returns in 1917 compared to 358 in 1913.
1922 – 1931
After World War I, tax rates were lowered again. For example, the top rate declined to 58% in 1922 and by 1925, it was down to 25%. The tax rates stay fairly similar during this time. Below is 1925 as an example.
Fun fact, the IRS used an undercover agent to gather evidence against Al Capone in 1931, and he was convicted of tax evasion.
1.5% > $0.00
3.0% > $4,000.00
5.0% > $8,000.00
6.0% > $10,000.00
7.0% > $14,000.00
8.0% > $16,000.00
9.0% > $18,000.00
10.0% > $20,000.00
11.0% > $22,000.00
12.0% > $24,000.00
13.0% > $28,000.00
14.0% > $32,000.00
15.0% > $36,000.00
16.0% > $40,000.00
17.0% > $44,000.00
18.0% > $48,000.00
19.0% > $52,000.00
20.0% > $56,000.00
21.0% > $60,000.00
22.0% > $64,000.00
23.0% > $70,000.00
24.0% > $80,000.00
25.0% > $100,000.00
1932 – 1963
During these years, higher tax rates were introduced again on higher incomes. For example, in 1932, 63% was applied on amounts above $1 million. By 1944, it was 94% on incomes above $200,000.
The tax code was regularly revisited between the 1940s and 1980s because the dollar amounts and thresholds were not automatically adjusted, and it became a huge problem with the high inflation in the 1970s.
A few fun facts:
- In 1944, the standard deduction was created through the Individual Income Tax Act.
- In 1953, the agency name changed from the Bureau of International Revenue to the Internal Revenue Service.
- In 1954, the filing deadline for individual tax returns changed from March 15 to April 15. (I’d love to see this changed again since tax season is crammed into two months.)
Below is how tax rates looked in 1963.
20.0% > $0.00
22.0% > $4,000.00
26.0% > $8,000.00
30.0% > $12,000.00
34.0% > $16,000.00
38.0% > $20,000.00
43.0% > $24,000.00
47.0% > $28,000.00
50.0% > $32,000.00
53.0% > $36,000.00
56.0% > $40,000.00
59.0% > $44,000.00
62.0% > $52,000.00
65.0% > $64,000.00
69.0% > $76,000.00
72.0% > $88,000.00
75.0% > $100,000.00
78.0% > $120,000.00
81.0% > $140,000.00
84.0% > $160,000.00
87.0% > $180,000.00
89.0% > $200,000.00
90.0% > $300,000.00
91.0% > $400,000.00
1964 – 1986
The top tax rate dropped to 77% in 1964 and to 50% in 1982. To reiterate from earlier, although the top tax rate was high, hardly anybody paid it.
Overall, tax rates dropped during this era. They had risen during the time around World War II to help pay for increased spending. It was during World War II that income taxes went from a “class tax” to a “mass tax.” Instead of only applying to higher levels of income, taxes were introduced at lower levels of income.
Although tax rates went down following World War II, federal tax receipts as a percent of GDP has roughly remained level from the 1940s until now.
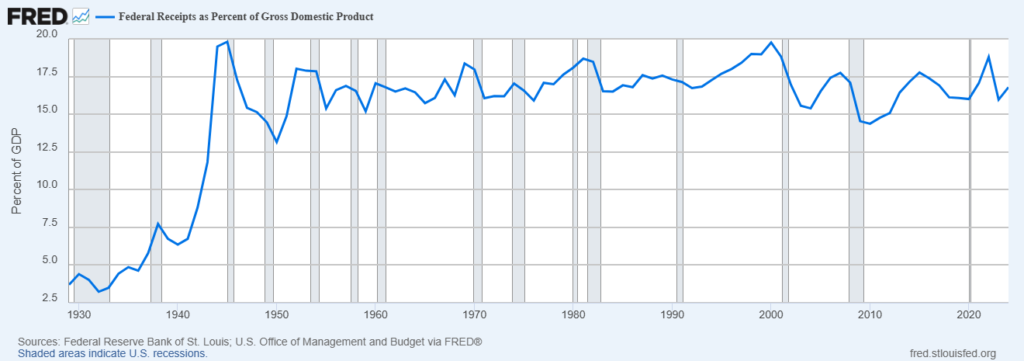
Source: https://fred.stlouisfed.org/series/FYFRGDA188S#
In 1981, the Economic Recovery Tax Act made it so that new tax rates were indexed for inflation automatically.
1987 – 1992
The Tax Reform Act of 1986 simplified the tax brackets from 15 brackets down to two brackets (15% and 28%) for three years (1988, 1989, and 1990). Then three brackets for 1991 and 1992 (15%, 28%, and 31%).
Below is an example from 1992.
15.0% > $0.00
28.0% > $35,800.00
31.0% > $86,500.00
1993 – 2001
The Omnibus Budget Reconciliation Act of 1993 changed taxes once again. It added an income tax bracket and a surtax on income above $250,000.
Below is an example from 1993.
15.0% > $0.00
28.0% > $36,900.00
31.0% > $89,150.00
36.0% > $140,000.00
39.6% > $250,000.00
The Roth IRA was created in the Taxpayer Relief Act of 1997. It also introduced the Child Tax Credit, tax credits for high-education expenses, and deductions for student loan interest. It also reduced capital gains taxes from 28% to 20%.
It was also during this period that we saw our last government surplus. Since 1970, we’ve only had a surplus from 1998 through 2001.
2002 – 2012
Since 2001, we’ve primarily seen tax cuts. The economic Growth and Tax Relief Reconciliation Act of 2001, known as the “2001 Bush Tax Cuts”, lowered the lowest tax bracket from 15% to 10%, increased the child tax credit, reduced marriage penalties, increased retirement contribution limits, and increased the estate tax exemption amount over time with repeal of it scheduled for 2010.
Below is how tax rates looked in 2002.
10.0% > $0.00
15.0% > $12,000.00
27.0% > $46,700.00
30.0% > $112,850.00
35.0% > $171,950.00
38.6% > $307,050.00
The 2003 Bush Tax Cuts further made changes by reducing tax rates on capital gains and accelerated individual income tax rate reductions.
Both tax cuts had sunset provisions, meaning they would have ended in 2010.
Obama passed the Patient Protection and Affordable Care Act in 2010, which created the net investment income tax (NIIT) of 3.8% and Additional Medicare tax of 0.9% on certain levels of income. It also created premium tax credits to subsidize health insurance costs on the exchange.
For those heirs with loved ones who died in 2010, there was no estate tax.
The Bush tax cuts were extended through the end of 2012, and there was also a temporary 2-percentage-point payroll tax cut for 2011 to help the economy recover after the Great Recession.
The American Taxpayer Relief Act of 2012 made most of the Bush tax cuts permanent, but it also raised the top tax bracket from 35% to 39.6% and increased the top estate tax rate from 35% to 40%.
2013 – 2017
Below is how tax rates looked in 2013.
10.0% > $0.00
15.0% > $17,850.00
25.0% > $72,500.00
28.0% > $146,400.00
33.0% > $223,050.00
35.0% > $398,350.00
39.6% > $450,000.00
These tax rates continued, adjusted for inflation, until the end of 2017.
The Tax Cuts and Jobs Act was passed in 2017, and it lowered individual income tax rates, doubled the standard deduction, limited itemized deductions like SALT, and lowered the corporate tax rate from 35% to 21%, as well as made many other changes.
Many of these changes were due to sunset at the end of 2025.
2018 – 2025
Below are how the tax rates looked starting in 2018 after the Tax Cuts and Jobs Act.
10.0% > $0.00
12.0% > $19,050.00
22.0% > $77,400.00
24.0% > $165,000.00
32.0% > $315,000.00
35.0% > $400,000.00
37.0% > $600,000.00
As you can see, tax rates were lower for all income groups.
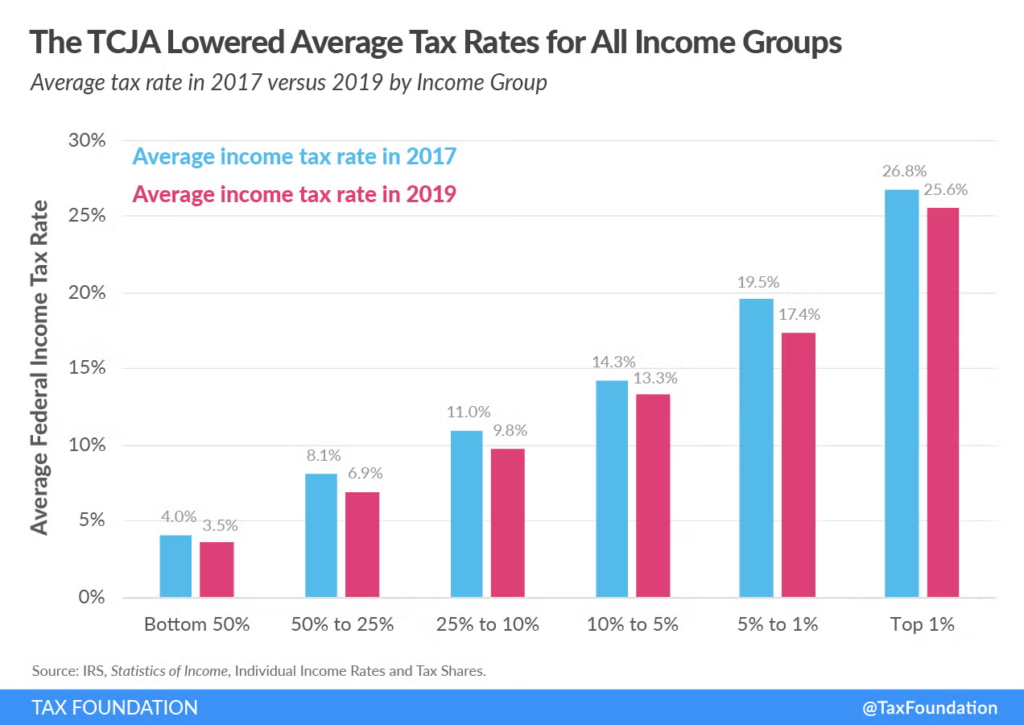
Source: https://taxfoundation.org/taxedu/glossary/tax-cuts-and-jobs-act/
Then, the One Big Beautiful Bill Act of 2025 made the majority of the TCJA tax cuts “permanent.”
I use quotes for permanent because as you have read, not much in our tax code is permanent! It simply exists until a new change is made.
Historical Capital Gains Tax Rates
Although this article has focused on income tax rates, it’s also worth looking at top capital gains tax rates since that could also be a source of future tax revenue for the government, and it impacts tax planning.
Unlike ordinary income tax brackets, capital gains have primarily floated between a narrower range.
The top long-term capital gains tax rate has primarily been between 15% and 39.875%.
Source: https://taxpolicycenter.org/briefing-book/how-are-capital-gains-taxed
There have only been a few periods of time where it went above 30%. In other words, although it could go higher than 30%, for many people, it’s been between 15% and 25%.
It currently sits at 23.8% today, though it requires a very high level of income to reach the 20% tax rate and then you add the 3.8% Net Investment Income Tax to reach 23.8%.
If you plan appropriately, you can even pay 0% on long-term capital gains!
Interestingly, the average effective tax rate (i.e. taxes paid on capital gains divided by total realized capital gains) has hovered between 14.1% and 26.2% going back to 1954. In other words, capital gains haven’t been much of a burden compared to ordinary income tax rates.
There has been a renewed push to tax capital gains as ordinary income in the public discourse. Although it’s possible, the only time period capital gains were taxed at ordinary income rates on a federal level was 1913 to 1921 and 1988 through 1990.
(Surprising) Discovery About Tax Rates
Despite the plethora of tax changes over the last 100 plus years and tax rates jumping all over the place, the average individual income tax rate has stayed within a fairly narrow range.
As you can see in the table below, individual income tax rates have generally been in a narrow range, but have gone down for most households, regardless of what quintile they fall.
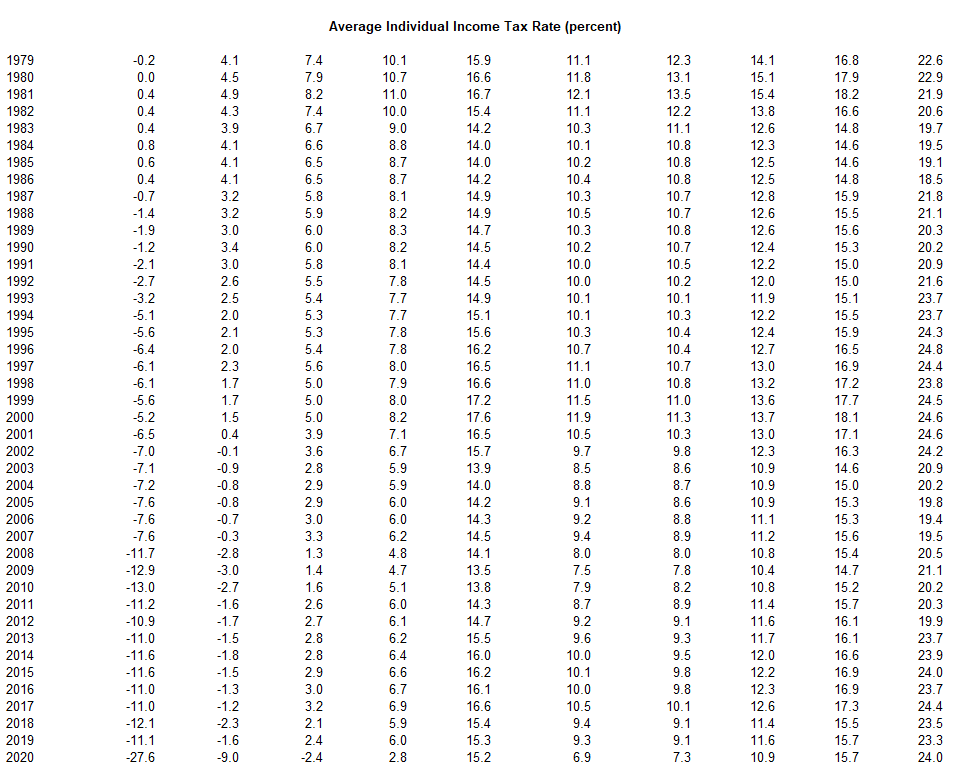
Source: https://taxpolicycenter.org/statistics/historical-average-federal-tax-rates-all-households
It’s much lower for the people in the bottom 20% of incomes.
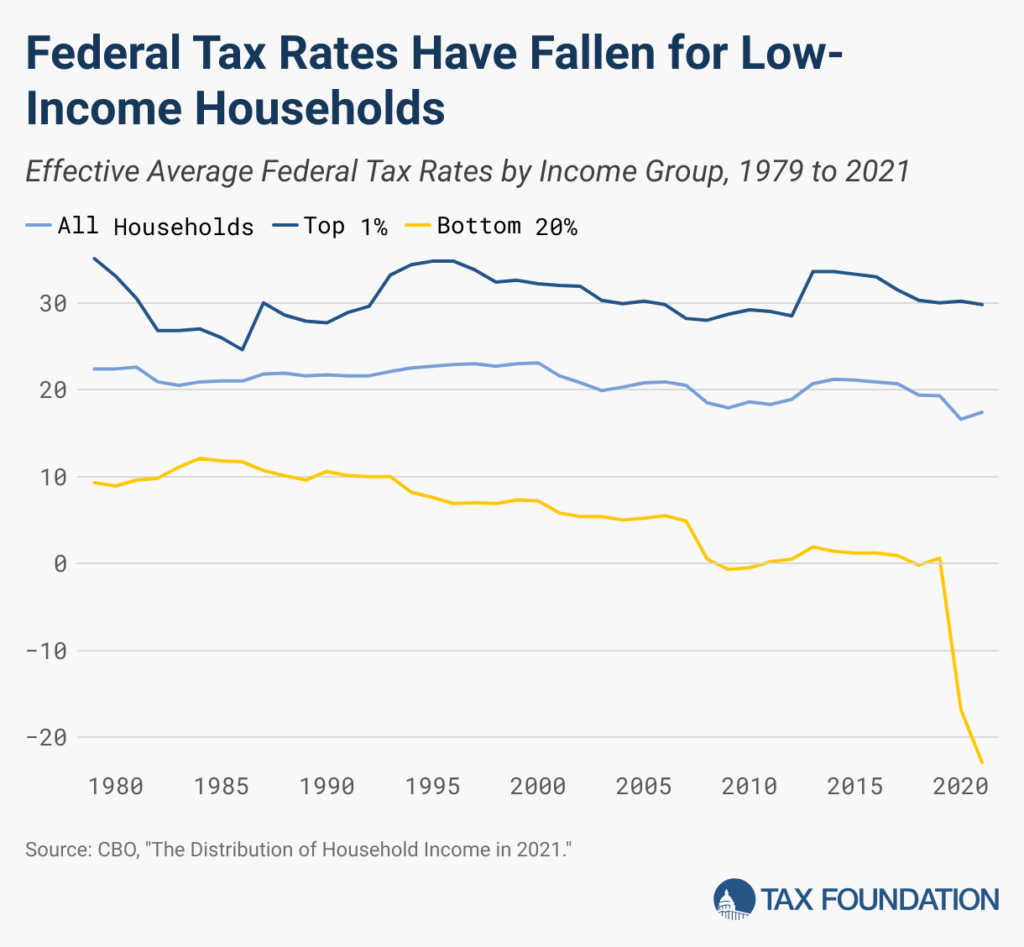
Source: https://taxfoundation.org/blog/us-effective-tax-rates-wealthy-progressive/
While it’s been a fairly narrow range, even a few percentage points can be meaningful. For example, if we compare the 81st to 90th percentages in 1979 (12.3%) vs. 2020 (7.3%), and assume you have $200,000 of income that is being taxed five percentage points less, that is $10,000 in tax savings.
That’s worth thinking about and planning for taxes.
How Taxes Impact Behavior
Any tax discussion is incomplete without a section about how taxes impact behavior.
Many people argue, “Let’s raise taxes!” Many call for tax rates that exceed 90% on the richest Americans. I’m not saying whether that is a good or bad idea.
But, I will say that very few people paid that rate when we had 90% tax rates, so that should tell you something about tax adherence if it becomes burdensome in the eyes of the taxpayer.
The Tax Foundation has an excellent article about the impact of taxes on building design, consumption, smuggling, alcohol production, transportation, and capital gains recognition.
People like to assume you can simply raise or lower taxes without any consequences, but research shows otherwise.
The article talks about how houses in Amsterdam are narrow because of a 16th century building tax on a property’s width.
Even the type of candy bar you purchase may be influenced by taxes. In states that don’t tax groceries, Twix may be purchased more often than Reese Peanut butter cups because Twix has flour, which makes it a food product and not candy, meaning there is no sales tax. The definition of candy and how it is taxed can influence product creation and consumption.
New York has a high excise tax on cigarettes. The state excise tax is $5.35 per pack and New York City has an excise tax of $1.50, meaning in New York City, the combined excise tax is $6.85. It’s estimated that to avoid those high excise taxes, over half the cigarettes smoked are smuggled. That’s 280 million packs a year or about $1.1 billion in lost revenue!
You may see more hard seltzers on shelves because they can be made by fermenting sugar, rather than distilling. Since it’s brewed like beer, it’s taxed like it, which avoids the distilled spirits excise tax.
Denmark levies a 150% excise tax on new vehicle purchases, which means a $30,000 car in the U.S. would cost $75,000 in Denmark. Although bikes are part of the culture, the increased tax probably encourages people to bike more because many can’t afford new cars.
You can also see how much in capital gains are realized as capital gains tax rates rise or fall. When capital gains tax rates fall, more capital gains tend to be realized. You can see that in the chart below.
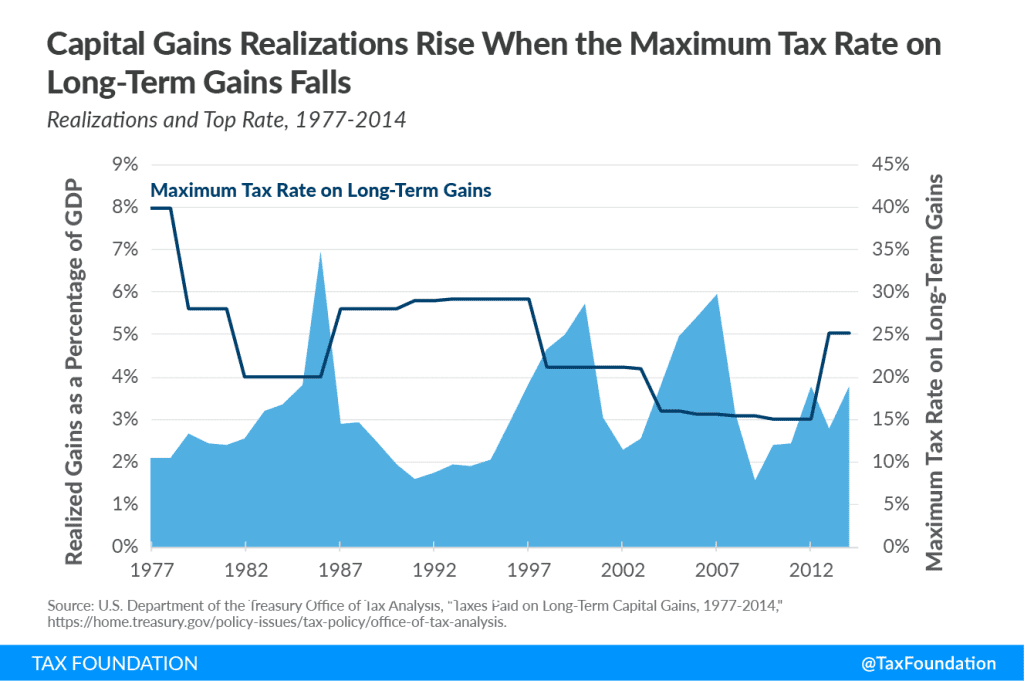
Source: https://taxfoundation.org/taxedu/primers/primer-the-weird-way-taxes-impact-behavior/
Any change in the tax code or with tax brackets should be weighed against how people may respond to those changes.
We can say we want higher tax rates, but at a certain level, it becomes cheaper to pay attorneys and accountants to come up with clever strategies to avoid them.
We also have a huge problem with tax evasion and lack of enforcement. It’s estimated that $441 billion in federal taxes is not paid each year, though it could be as high as $1 trillion. On top of that, it’s estimated that each dollar of investment in IRS enforcement programs would produce $12 in additional revenues.
Is the US National Debt a Concern?
Many people point to our national debt and argue tax rates have to go up to bring our national debt under control.
It’s hard to argue that the national debt isn’t a concern.
In 2023, U.S. debt was 123% of GDP. While Italy and Japan were higher, at 135% and 250%, respectively, it’s difficult to look at either economies as the model the U.S. wants to replicate. Many other countries, such as Switzerland and South Korea, operate stricter budgets.
When interest rates were low, servicing debt was less of a concern. As interest rates have gone up and are still below historical norms, it’s likely that the debt is going to be more of a burden. It’s already estimated that net interest payments on debt will be $1 trillion in 2026.
That’s more than spending on Medicare, national defense, or Medicare, three programs that frequently see critiques for the amount of money being spent on them.
The consistent gap between revenue and spending provides less policy flexibility moving forward, particularly during slowdowns or shocks to the economy. A large budget deficit during a recession isn’t necessarily a bad thing. It can be helpful to the economy. But when you aren’t in one and you continue spending like you are in one, it makes the next one that much harder. It also makes investing for the future harder as you are paying for past decisions.
It feels a little like the U.S. is that drunk uncle that makes poor decisions while being drunk, but once in a while sobers up; however, it continues spending and making the same poor decisions when it might be wiser to put more money away for a rainy day.
At the same time, the U.S. doesn’t have to run its balance sheet like a personal balance sheet. The goal doesn’t have to get to zero debt. One could argue that would stifle growth and hurt the economy.
Does that mean income tax rates necessarily have to go up?
Not necessarily.
The government has two levers: reduce spending and/or increase revenue.
Could they solve the debt problem by simply reducing spending? I suppose anything is possible.
But, I do think it’s more likely based on history that we see tax rates rise. Whether that is income taxes, or another form of tax, remains to be seen. We could see more taxes based on consumption, energy, or environmental taxes. Other countries have a value-added tax, and we could see that implemented. There are many paths forward to address the long-term deficits.
The key is for politicians from both sides of the aisle to get real about what policy decisions would be needed to reduce the debt and stop putting band-aid solutions on the current pain points of voters. It also requires voters to look beyond themselves to make tough decisions and vote in a way that makes things better for future generations.
It’s easier to make small gradual changes that are painful than to wake up one day needing to make a drastic change that immensely hurts.
Frankly, it feels like we are headed more for a drastic change at some point.
Financial Planning Implications for the Possibility of Rising Tax Rates
So, what the heck do we do with this history lesson and information?
Here is what I’ve observed, and then I’ll tell you how I’m thinking about it for financial planning and tax planning purposes.
- Larger recessions tend to result in tax legislation that produces lower taxes, but increases the deficit. Good times tend to result in higher taxes, but not always.
- Wars are expensive and historically have generally been partially financed with tax increases.
- Our rising national debt and ability for politicians to ignore it feels like we are walking around with a stick of dynamite lit with an unknown fuse length. It does feel unsustainable at current levels, particularly as interest rates go up.
- Our tax rates are relatively low compared to other countries.
- There are other levers politicians can adjust to raise revenue, such as changing deductions, introducing new types of taxes (i.e. the switch from primarily tariffs to income in the past, VAT taxes that are popular in other countries, or a wealth tax), enforcing the current tax structure better through improved IRS funding (I’d suggest looking at “reasonable salary” for S Corp owners), or finding other ways to boost economic activity, such as increasing the labor force.
- We could reduce our spending, but historically, that has rarely happened.
- Our tax code has progressively become more complicated.
Tax legislation rarely incorporates one idea. I’m not sold that tax rates are simply going to rise on individuals, but I would take a bet that most people reading this are going to see higher tax rates at some point in their life, if for no other reason than I think we’ll see a decent-sized recession, war, or other major national issue, which often leads to tax changes.
I also think we’ll see new types of taxes like we’ve seen created in the past. Politicians like to get creative to stimulate certain parts of the economy or to appeal to lobbyists.
Trying to simplify our tax code feels like a herculean task, particularly now when it feels like we are further disconnected from how our tax dollars are spent and the feeling of patriotism people may have felt paying taxes in the past has evaporated.
For those who are younger and earning income, you often have the choice of whether to contribute to your 401(k) with pre-tax dollars or contribute Roth dollars. Choosing one or the other, or a split of both, is a hard decision to make without mapping out future pre-tax balances, anticipated inheritances (and type of tax treatment of those inheritances), and other sources of income. It’s a worthwhile exercise trying to map it out to make a more proactive, informed decision.
For those in the retirement phase of life, the question becomes, “Am I willing to pay tax at the current rate today to potentially hedge higher tax rates in the future (either because tax rates rise or because my income will push me or my heirs into a higher tax bracket)?” That also requires a careful exercise in creating a financial plan, mapping out estimated tax rates, and then deciding whether a Roth conversion would be helpful.
Then, you get to take a guess at future tax rates and when they might change.
As we saw, tax rates have bounced up and down for more than 100 years. In any tax legislation, there are “winners” and “losers” with the amount of tax you’ll pay. It’s impossible to predict, which means any proactive tax planning decisions you make today is simply you saying, “I am comfortable with this choice given the data I have.”
That’s the best we can do.
Final Thoughts – My Question for You
It appears that tax rates tend to rise or fall depending on how the country is doing and whether we are in a war.
Given historical tax changes, I’d be willing to make a speculative guess that in the next decade or two, we see higher tax rates. I also think we’ll see lower tax rates again at some point after.
When exactly we will see those changes is a different story. It could be a few years or much longer.
My crystal ball is cloudy and always will be.
I do know that for people who did a great job saving and have large IRA balances, they may simply be in a higher tax bracket later due to RMDs, pensions, rental income, and Social Security. And their heirs may be in a higher bracket as they have to take money out of an Inherited IRA within 10 years in most cases — sometimes during their peak earning years.
In the meantime, from a tax planning perspective, it may make sense to hedge against higher future tax rates — either for you or for your heirs.
I’ll leave you with one question to act on.
Given what you know, what actions will you take for your own tax planning?
P.S. If you are feeling overwhelmed with how this could apply to you and want to discuss it further, please schedule a time with me: https://kindnessfp.com/free-consultation/.